


Elastic Stack 7.5.0 released
We’re excited to announce the general availability of version 7.5 of the Elastic Stack. Along with the introduction of Kibana Lens, a fast and intuitive way to craft visualizations, this release offers significant enhancements to our Observability and Security solutions and Elastic Enterprise Search joins the 7.5 release train.
Read on to see the highlights and dive into the detailed release posts for all the details.
Introducing Kibana Lens: An entirely new data visualization experience
Kibana is, and has always been, the best way to visualize data stored in Elasticsearch and to navigate the Elastic Stack. With 7.5, we’re introducing Kibana Lens — an entirely new way to craft visualizations. Lens is designed to work the way you think, to let you rapidly go from raw data to meaningful visualization without needing any previous technical experience or knowledge of Elasticsearch. It starts with a new drag-and-drop experience, along with the ability to easily switch between chart types and different index patterns. As you add fields to your chart, Lens provides smart suggestions to show you other views of your data. Combined with the speed of Elasticsearch, Lens makes it faster and easier than ever to visualize, explore, and understand your data.
Want to learn more about Lens? Read all the details in the Lens release blog post. Or check out the Kibana blog post to see all the other Kibana features in 7.5.
Index time enrichment in Elasticsearch gets even richer
Way back in Elasticsearch 5.0, we first introduced the Ingest Pipeline — a way to process and enrich documents at indexing time. By building this directly into Elasticsearch, configuration via API is simple, scaling out is easy, and performance is quite fast. Over the years, we've seen wide adoption of this feature and we now rely on it for processing and enrichment in nearly all of our modules — the many data sources that we natively support. Whether it's parsing a log line with grok or dissect or adding location data to an IP address, ingest pipelines are increasingly the workhorse doing the ingest-time processing in the Elastic Stack. With the 7.5 release, we're thrilled to be delivering one of the most requested features: lookup-based enrichment. The new Enrich processor provides an efficient way to query an Elasticsearch index and add the results to your document at indexing time. This allows you to do things like identify web services or vendors based on known IP addresses, add postal codes based on user coordinates, or look up host information ingested from a configuration management database and add the relevant metadata to your document right at indexing time.
To read more about the enrich processor and see all the new Elasticsearch features in 7.5, check out the Elasticsearch blog post.
The Elastic Stack also hosts our solutions: tailored applications for our most common use cases. Read on to see some of the highlights around Observability, Security, and Enterprise Search.
Elastic Enterprise Search
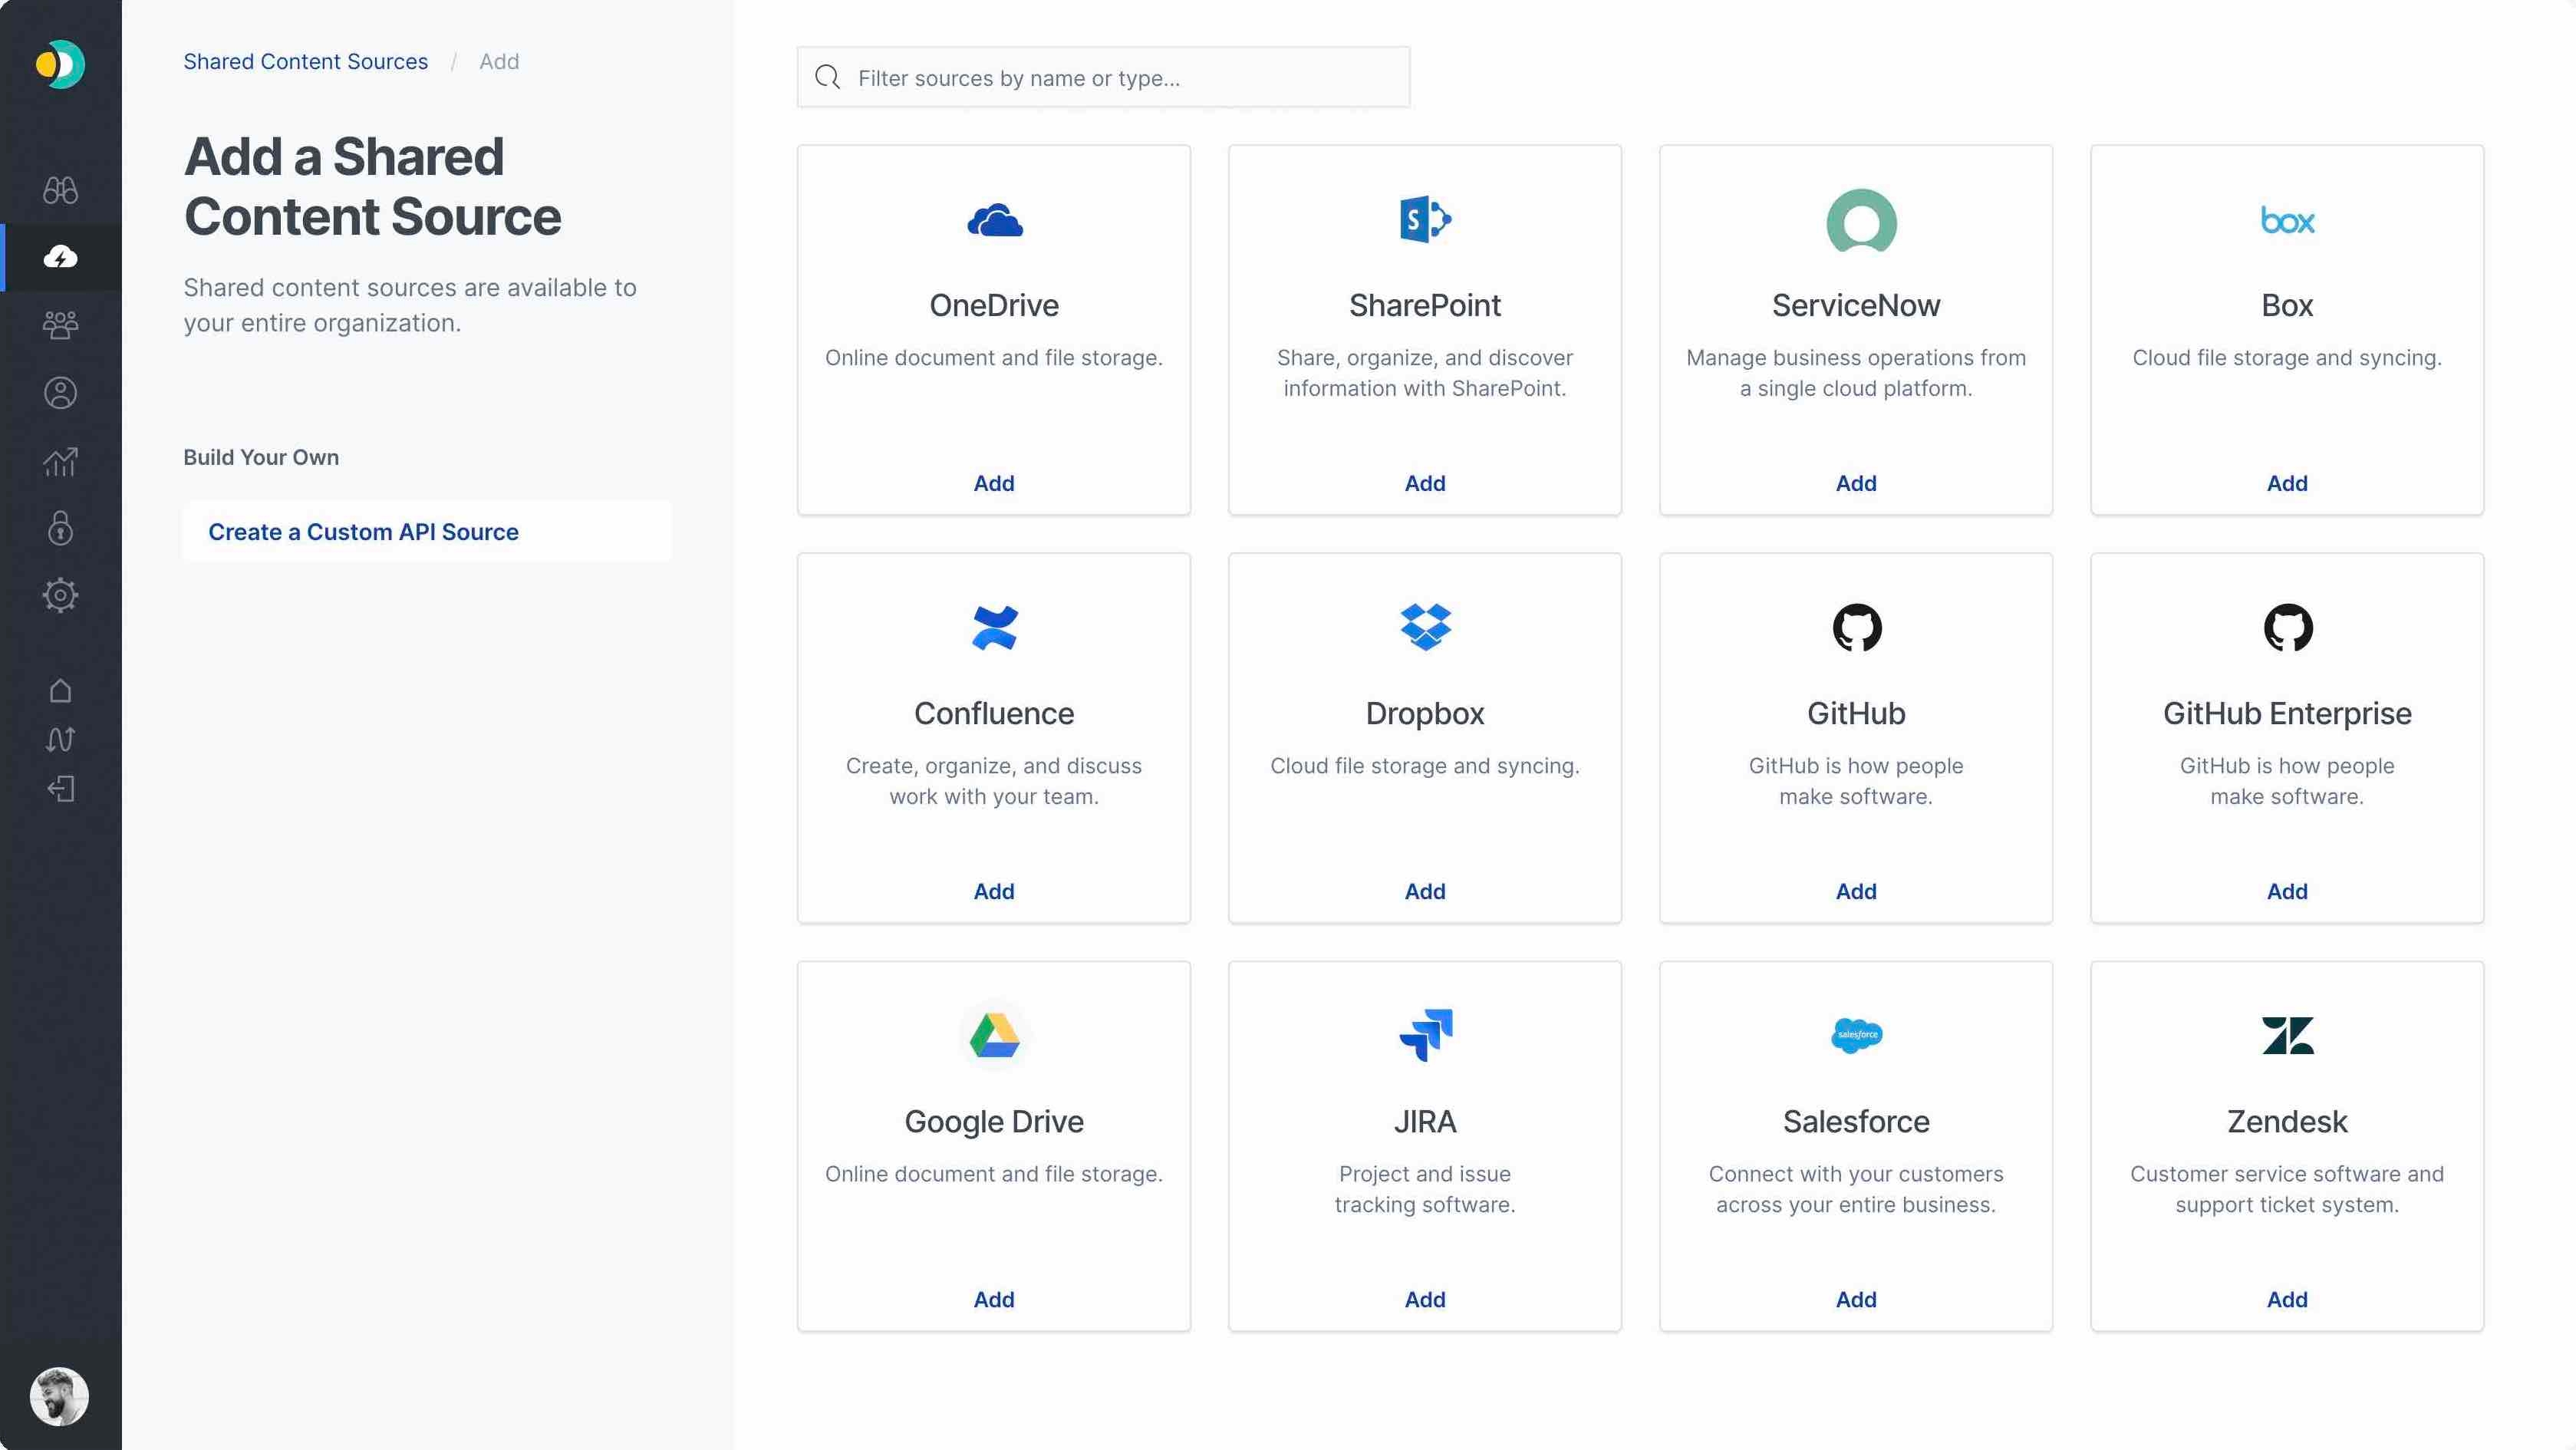
Elastic Enterprise Search aims to connect people and teams to the content that matters most to them. For organizations with a significant Microsoft product footprint, Elastic Enterprise Search now provides one-click integrations with SharePoint Online, Office 365, and OneDrive, making it easier than ever to unify and search across content platforms. To top it off, Enterprise Search also includes a brand new ServiceNow connector, allowing you to centralize all business operation information in one place. With these new sources now available alongside the ones already included — Salesforce, Google Drive, Atlassian JIRA, Confluence, Dropbox, and more — your team can now focus on the task at hand.
Elastic Enterprise Search is now being versioned and released with the Elastic Stack, which makes this the 7.5.0 release, and it remains in beta for the time being. To learn more about what’s new, check out the Enterprise Search blog post.
Elastic Observability
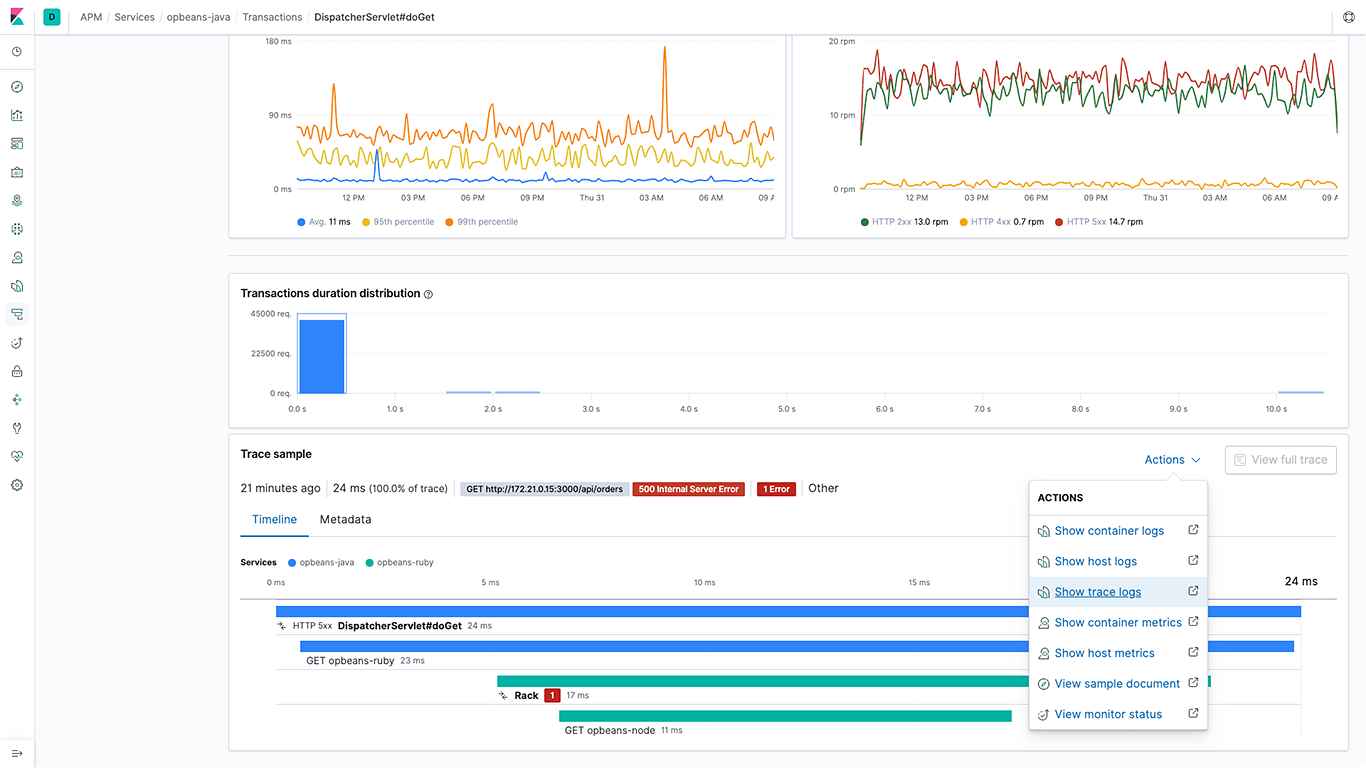
At Elastic, we believe that to truly understand your applications and infrastructure, you need to be able to see, or observe, each layer. Elastic Observability brings together our Elastic Logs, Metrics, APM, and Uptime products to give a more complete and comprehensive view across your organization. Version 7.5 of the Elastic Stack brings a significant expansion of the Elastic Metrics story and adds several key integrations between APM, logging, and security data for organizations adopting observability initiatives.
Our metrics story has gained steam in recent releases with the addition of Metrics Explorer, a purpose-built user interface for real-time metrics analytics. We’ve also made it easier to get started with metrics using turnkey data integrations for the most important infrastructure and service metrics, including Kubernetes, Prometheus, and Amazon Web Services (AWS). In 7.5, we build on that momentum by introducing turnkey monitoring of Microsoft Azure metrics and logs as part of our partnership with Microsoft. Finally, we have also added initial support for viewing endpoint security data directly in the Elastic Metrics and Logs apps. These advances help Elastic Stack users set up monitoring of critical services more quickly and enable them to combine metrics with important events, such as audit logs from endpoint devices, more efficiently.
To learn more, check out the Observability blog post.
Elastic Security
It is an exciting time for folks using the Elastic Stack to protect their organizations. Since our last release, we joined forces with Endgame, a leading endpoint security company, and we announced the end of per-endpoint pricing for the EPP/EDR space. Unlimited endpoints are now included with our Enterprise subscriptions, so you no longer need to choose which machines deserve protection. For servers, if you’re already collecting security and operational data, why not protect them at the same time? And it isn’t just about servers; the security events from all of your infrastructure, including desktops and laptops, should be available to your security analysts. Version 7.5 of Elastic SIEM now includes endpoint security data and alerts directly in the SIEM app.
The 7.5 release of Elastic SIEM also continues our push to detect threats using machine learning, from identifying unusual patterns in DNS activity that could indicate DNS tunneling or command and control behavior, to unusual logins over RDP or using the runas command, and more. The SIEM app itself is expanding to include a number of new visualizations and widgets that make threat hunting easier, from interactive visualizations of host activity to a new TLS view that surfaces unusual certificates and simplifies hunting based on TLS fingerprints, such as JA3 hash.
To learn more about our vision around Elastic SIEM and Elastic Endpoint Security, watch the launch announcement here, or check out our Security blog post for the details about what’s new in 7.5.
There’s always more...
So much more. Check out the individual product blogs for the details on everything we added in 7.5:
The Elastic Stack
Solutions